
Last week ended with Operation Epic Fury…
…this week opened inside it.
If you read last week’s After the Bell section, you knew what was coming. The Iran strikes that began Friday evening rewrote the macro landscape over the weekend — and when the Rand reopened on Monday morning, the Budget’s goodwill was already fading.
What followed was one of the most volatile weeks in recent memory. Three distinct shocks hit in five days — the Iran aftermath, Trump’s new 15% global tariff, and a US jobs report so far below expectations that it temporarily broke the narrative.
The result? Two hundred and ten cents of total movement. Three distinct shocks. And a Rand that ended the week approximately 38 cents weaker than it opened — but showed something important on Friday afternoon.
But Friday’s final hours told a different story…
…one that matters more than the headline number suggests.
Here’s how this rollercoaster unfolded…
The Rand finished the week at approximately R16.50/$ — a ~38-cent loss (2.4%) from Monday’s open of R16.12, with 210 cents of total movement across all five sessions starting from last Friday’s close of R15.92.
Key Moments (2–6 March 2026)
These were some of the major headlines and events over the past five days:
🇿🇦 Naamsa Vehicle Sales Hit 13-Year February High (Mon 2 Mar): 53,455 units sold — up 11.4% year-on-year. The strongest February since 2013. A quiet positive buried beneath the geopolitical noise.
⛽ SA Fuel Price Hike Effective (Tue 3 Mar): Petrol up 20c/litre, diesel up 65c/litre — effective from 4 March. The diesel increase, driven by the oil spike following the Iran strikes, adds direct cost pressure for logistics and agriculture.
📊 Absa PMI Still Below 50 (Mon–Tue): Manufacturing PMI printed at 47.4 — the fifth consecutive month of contraction. SA’s factory sector hasn’t expanded since October.
🏭 ISM Manufacturing Prices Paid Surge to 70.5 (Mon 2 Mar): The US factory inflation gauge jumped from 59.0 to 70.5 — the highest since mid-2022. Markets read it as a tariff-driven inflation spike. The Rand didn’t wait for confirmation.
💥 Trump’s 15% Global Tariff Confirmed (Tue 3 Mar): Treasury Secretary Bessent confirmed the tariff framework on Tuesday. Not new policy — but the formal confirmation removed any remaining ambiguity. Risk-off hit immediately.
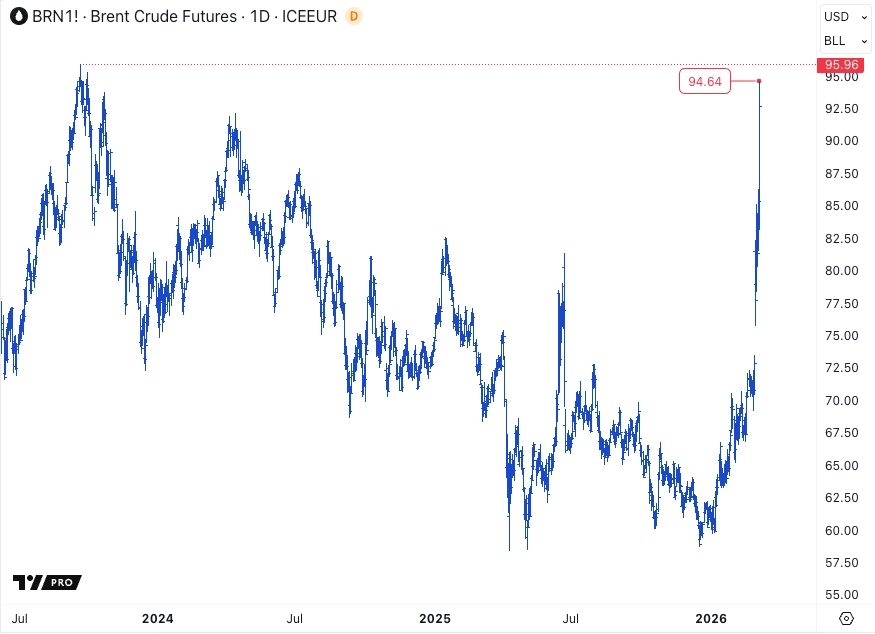
🛢️ Strait of Hormuz Effectively Closed (Week-long): Operation Epic Fury — the US-Israeli strikes that killed Supreme Leader Khamenei and targeted Iran’s nuclear facilities — triggered Iran’s IRGC to formally close the Strait of Hormuz on 2 March. Crude surged from over $90/barrel to $114 on Monday — its highest since the COVID-19 pandemic — and has continued climbing since. For a net oil importer like South Africa, this is direct balance-of-payments pressure on the Rand.
👷 US NFP: –92,000 vs +59,000 Expected (Fri 6 Mar): The worst Non-Farm Payrolls miss in years. The US economy shed 92,000 jobs against expectations of a 59,000 gain. Unemployment rose to 4.4%. Wages held at +0.4% MoM. The initial reaction weakened the Rand further — then came the reversal.
📈 Monday, 2 March — The Aftermath Opens Quietly
Monday opened with Iran’s shadow over everything…
…but the Rand’s reaction was more muted than you might expect.
USD/ZAR gapped up at the open — R16.12, approximately 20 cents above last Friday’s close of ~R15.92 — as the weekend’s Iran strikes forced an immediate geopolitical repricing. That gap at the open was the market pricing in a new world before a single trade was placed. But the pair didn’t run higher immediately. Instead, it drifted in a relatively contained 22-cent range through the session, touching a high of R16.21 in the early morning before pulling back to a low of R16.00 during the European session.
The ISM Manufacturing PMI (52.4) was a modest beat, but it was the Prices Paid component at 70.5 that caught attention. That’s up from 59.0 — a jump that markets immediately connected to the tariff environment. Factory input costs surging? That’s the tariff inflation transmission mechanism in real time.
Domestically, the Naamsa vehicle sales data — 53,455 units, up 11.4% YoY — was genuinely strong. The best February in 13 years. But it barely registered. (When oil routes are disrupted and tariff confirmation is pending, auto sales figures don’t move the currency.)
Close: R16.10 — essentially flat on the day, down roughly 2 cents from the open. A contained response to an extraordinary backdrop.
💥 Tuesday, 3 March — The Day Everything Broke
Tuesday was the week’s defining session…
…and it wasn’t close.
The pair opened at R16.12 and held relatively steady through the Asian session. Then two things hit simultaneously in the early afternoon: Bessent’s formal tariff confirmation and the full market digestion of Monday’s ISM Prices Paid print. The combination was devastating.
USD/ZAR erupted. From R16.07 in the morning, the pair climbed relentlessly through the afternoon — smashing through R16.30, then R16.50, before hitting R16.76 by mid-afternoon. A 70.6-cent intraday range. The biggest single-session move of the week.
The Absa PMI at 47.4 — confirming SA’s fifth consecutive month of manufacturing contraction — provided no counterweight. When the global macro turns hostile, domestic data becomes noise.
But the most telling detail? The RMB/BER Business Confidence Index, released the same day at 47 — an 11-year high for SA business confidence. Under normal conditions, that’s a Rand-positive headline. On Tuesday, it was irrelevant. The global risk-off trade overwhelmed everything local.
Close: R16.53 — a brutal 41-cent weakening on the day. The biggest directional move of the week.
(If you were managing an open USD exposure on Tuesday… you felt every one of those 70 cents.)
📉 Wednesday, 4 March — The Recovery That Wasn’t Enough
After Tuesday’s carnage, Wednesday brought a partial recovery…
…but “partial” is doing a lot of work in that sentence.
USD/ZAR opened at R16.55 and immediately showed signs of stabilisation. The pair drifted lower through the morning session, testing R16.35 by midday as some of Tuesday’s panic positioning unwound. The low of R16.29 came during the European afternoon — a 19-cent recovery from Tuesday’s close.
The ADP Employment report came in at just 63,000 — well below expectations. Under normal circumstances, weak US jobs data weakens the Dollar and helps the Rand. On Wednesday, it barely registered. The ISM Services PMI at 56.1 was solid but irrelevant in the current environment.
What Wednesday showed was that the Rand had found a temporary floor around R16.29–R16.35 — the Budget-era resistance level that was now functioning as support from the other direction. The levels hadn’t changed; the Rand’s relationship to them had.
Close: R16.34 — a modest 19-cent recovery. Better than Tuesday, but nowhere near enough to reclaim the pre-shock levels.
And in other news…
The GNU Fracture — Foreign Policy Edition 🇿🇦
Operation Epic Fury — the coordinated US-Israeli campaign that delivered an estimated 2,000 strikes against Iran’s nuclear facilities and military infrastructure, and which killed Supreme Leader Ali Khamenei — didn’t just move the currency. It exposed fault lines inside the Government of National Unity.
The ANC and DA found themselves on opposite sides of the Iran response. The ANC’s historical alignment with Iran and Palestine clashed with the DA’s more Western-aligned position. For a coalition that has so far held together on economic pragmatism, this was the first serious test on foreign policy…
…and the market noticed. Not because traders care about parliamentary debates, but because GNU stability is priced into the Rand’s post-election premium. Any crack in that coalition threatens the very framework that the Budget was built on.
Gold’s Crash From Grace 🥇
Gold’s week was more complicated than the headlines suggest. The metal spiked to an intraday high of $5,419 on Monday as investors reached for a traditional safe haven in the immediate aftermath of the Khamenei killing. Then reality reasserted itself, and it sold off hard, giving back roughly 2.5% from pre-week levels by Friday’s close.
The irony? In a week of genuine geopolitical crisis, the traditional safe haven ultimately sold off. The explanation: when the Dollar itself becomes the safe haven (DXY had its best week since 2022), gold gets sold to raise Dollar liquidity. For context: gold’s sharpest correction this year came in late January — a 17%+ crash that took it all the way down to $4,402. This week’s 2.5% reversal is a setback, not a capitulation. For SA’s mining sector and Rand support, a gold price under pressure removes one of the currency’s traditional tailwinds at exactly the wrong time.
Oil and the Hormuz Problem 🛢️
Crude’s surge from over $90/barrel to $114 on Monday — the highest level since the COVID-19 pandemic — isn’t just a headline number. As of this writing, it has pushed even higher. It’s a structural problem for South Africa.
The Hormuz closure is total. Iran’s IRGC formally shut the strait on 2 March — the chokepoint through which 21% of global oil supply flows. Over 150 vessels are anchored outside, unable to transit. Two commercial ships were attacked during the week: the Skylight (two Indian crew members killed) and the MKD VYOM (a drone boat strike, fire onboard, one Indian sailor killed). The IRGC’s message is unambiguous: the strait is closed until further notice.
SA imports roughly 95% of its crude oil. When Hormuz is disrupted, the cost of those imports rises immediately. Tuesday’s fuel price hike (petrol +20c, diesel +65c effective 4 March) was based on pre-disruption pricing. The next adjustment — likely in April — will reflect the full Hormuz impact.
For importers: higher oil = wider current account deficit = structural Rand weakness. This isn’t a one-week story.
To get back to the Rand…
⚡ Thursday, 5 March — Second Leg Weaker
Thursday brought a second leg of Dollar strength…
…driven less by new shocks and more by the accumulated weight of the week.
USD/ZAR opened at R16.32 — close to Wednesday’s close — and ground steadily higher through the session. No single catalyst drove the move. Instead, it was the combination of persistent Hormuz uncertainty, elevated oil prices, and pre-NFP positioning that pushed the pair upward.
Initial Jobless Claims at 213,000 confirmed a still-tight US labour market (the irony of which would become apparent 24 hours later). Nonfarm Productivity at +2.8% was solid. Neither moved the needle.
The pair touched R16.75 in the late session — testing levels last seen during Tuesday’s spike — before settling slightly lower.
Close: R16.65 — a 31-cent weakening from Wednesday’s close. Thursday confirmed that Tuesday wasn’t a one-day panic; the repricing was sticking.
🔄 Friday, 6 March — The NFP Shock — And the Reversal Nobody Expected
Friday was supposed to be the week’s crescendo…
…and it was — just not the way anyone predicted.
USD/ZAR opened at R16.64 and drifted lower in the pre-NFP Asian and early European sessions, touching R16.55 by mid-morning as some traders squared positions ahead of the data.
Then at 13:30 UTC (15:30 SA time), the numbers hit: Non-Farm Payrolls at –92,000. Against an expectation of +59,000. Against a prior reading of +143,000.
Negative. The US economy didn’t just add fewer jobs than expected — it shed them. Unemployment jumped to 4.4%. Wages held at +0.4% month-on-month, but the headline was impossible to ignore.
The initial reaction? USD/ZAR spiked to R16.82 — the week’s high and the highest level since… well, since before the Budget rally began. The Rand’s safe-haven reflex: bad global data = risk-off = sell emerging markets.
But then something remarkable happened.
Within 90 minutes, the pair reversed. Hard. From R16.82 at 14:00 UTC to R16.55 by 15:30 UTC — a 27-cent snap reversal in 90 minutes. And then it kept going.
The conventional explanation? If the US economy is shedding jobs, the Fed is closer to cutting rates. Rate cuts weaken the Dollar. Dollar weakness helps the Rand. That’s what the economists say — and it’s not entirely wrong.
But there’s another layer. Our sentiment cycle analysis had already flagged that the Rand was approaching an overstretched condition at those spike highs — a pullback was overdue regardless of the catalyst. The NFP print gave the market a reason to do what the cycles were already pointing toward. The reversal wasn’t purely a rate-cut trade; sentiment was primed for it.
Close: approximately R16.50 — 14 cents stronger on the day, despite all that drama.
(That 27-cent snap reversal in 90 minutes told us something. The Rand recovered almost instantly when the Fed’s rate path shifted. That speed of recovery suggests the Budget’s fundamental story hasn’t been destroyed — it’s been temporarily overpowered.)
📊 Volatility & Risk Analysis
Here’s how the volatility played out this week:
• Open to Close Move: R16.12 → ~R16.50 — ~38c Rand WEAKER (2.4%)
• Average Daily Range: ~40.6c (2.5%)
Risk per $1M: R406,000
• Maximum Single-Day Move: ~70.6c (4.4%) on Tuesday — tariff shock
Risk per $1M: R706,000
• Weekly Range (High–Low): 82c (R16.00 low to R16.82 high) — 5.1% swing
Risk per $1M Exposure: R820,000
• Total Weekly Movement (all 5 sessions, starting from R15.92 prior close): ~210c
Risk per $1M if fully exposed all week: R2,100,000
vs. Budget Week (23–27 Feb): ~69c total — this week was 3.0× more volatile
Daily Range — USD/ZAR (cents)
| Mon 2 Mar | 29c | |
| Tue 3 Mar | 70.6c | |
| Wed 4 Mar | 34.6c | |
| Thu 5 Mar | 43.6c | |
| Fri 6 Mar | 32c |
Red = extreme range day — Tuesday 70.6c (tariff shock). Friday’s 32c range was contained despite the NFP drama.
For a business managing $1 million in USD obligations, Tuesday’s tariff shock carried R706,000 in intraday exposure. The average daily range of approximately R406,000 means that even the quieter sessions carried significant swing risk. The total movement across all five sessions — starting from last Friday’s close of R15.92 — was approximately R2.1 million per million dollars of exposure. Against Budget Week’s ~R690,000.
The risk-per-million numbers are not theoretical. They represent the actual cost of being on the wrong side of a move for even a few hours. Tuesday’s 70-cent range meant that an importer who covered at the day’s high rather than the day’s low paid an additional R706,000 per million dollars of exposure.
“Manage the timing of your exposures… …not just the direction.”
📅 The Week Ahead (9–13 March 2026)
⚠️ Iran/Oil: Dominant macro variable. Hormuz shipping, oil prices, any military escalation or diplomatic developments will override all scheduled data.
SA: SARB commentary on Iran/oil impact, Q4 GDP (11 Mar), Manufacturing production.
US: CPI inflation (12 Mar), PPI, University of Michigan Consumer Sentiment, Fed speakers.
EU: ECB rate decision (12 Mar).
For South Africa specifically, the Q4 GDP print on Tuesday 11 March is the headline domestic release. After five consecutive months of manufacturing contraction (PMI below 50), the GDP figure will tell us whether the broader economy is absorbing that drag or whether other sectors are compensating. A strong GDP number could provide some counterweight to the external pressure — but it’s unlikely to overcome the geopolitical headwinds alone.
Wednesday’s US CPI (12 March) will be closely watched in the context of Friday’s shocking NFP print. If inflation stays elevated while jobs are falling, the Fed faces a stagflationary dilemma — and that’s the worst-case scenario for rate cut expectations. The ECB decision the same day adds a second central bank dimension.
The key question for the Rand: has the post-Budget fundamental improvement been permanently repriced, or is the current weakness a temporary geopolitical overshoot? Next week’s data will start to answer that.
To round off…
This was a week that stress-tested everything.
The Budget’s goodwill — built painstakingly over a single Wednesday afternoon in Cape Town — was tested by forces that had nothing to do with South Africa’s fiscal position. Iran. Tariffs. A US jobs market that fell off a cliff. The Rand was caught in the crossfire of all three.
And yet.
Friday’s 27-cent reversal in 90 minutes told us something. In a week of extraordinary chaos, the Budget’s fundamental story hasn’t been destroyed — it’s been temporarily overpowered.
For subscribers who use our forecasting to time their forex exposures: weeks like this are exactly why timing matters more than direction. The difference between covering at R16.82 (Friday’s spike high) and R16.50 (the eventual close) was 32 cents — R320,000 per million dollars. Same day. Same data. Different timing.
We’ll be watching the Iran situation, oil prices, and next week’s CPI closely.
To your success~
James Paynter
P.S. ISM Prices Paid just jumped from 59.0 to 70.5. Highest since mid-2022.
That’s the tariff inflation pipeline — and it’s active.
But here’s what the headline misses: prices paid by manufacturers isn’t the same as prices charged to consumers. The pass-through question is everything — and it’s exactly what we unpacked in last month’s Market Demystifier, and debunked not just one tariff myth, but four. Get Your Copy here.
“Headlines tell you what happened…
…cycles tell you what’s coming.
The news explains the move after the fact —
…sentiment warned you before it happened.”
...and understand what's really moving markets
Here's what you'll discover:
- How the cycles work — and what to do when the wind changes
- Why most forex strategies fail (and it's not what you think)
- How to recognise turning points BEFORE they happen
- Why the Fed doesn't control interest rates
Plus much more...
No jargon. No predictions pulled from thin air. Just cycle structure + sentiment data + what it means for YOUR positioning. As well as simple layman's explanation of complex economics, and what this means for you.
Flying Blind Is Costly
This week proved once again that markets move in cycles, not linear economist logic.
While mainstream analysts were celebrating Tuesday's Dow record, our forecast system was already signaling the Rand would push through R17 before reversing...
...and it delivered, hitting R16.95 - dead centre of our predicted 17.08-16.89 range...
...before losing 25 cents in a classic reversal.
That's not luck.
That's systematic forecasting based on a combination of sentiment cycles, Elliott Wave, momentum, wave ratios & relationship studies, momentum and supply & demand...
...the same system that's kept us and our clients ahead of the curve for years.
Want to see where the Rand is headed next?
To get a look at the latest forecasts, use the link below:
Click here to view the latest forecasts
If you have any questions or feedback, please leave them below.
To your success~
James Paynter
Got any questions? Here's what to do:

2. Call us on 087 551 2848
3. Chat with us using our Whatsapp chat
P.P.S. Want some insights as to where the Rand is likely to move - enabling you to make educated and informed decisions - ahead of time?
Take our Rand Forecasting service for a test-drive using the link below
No charge. No card. All yours to try out for 14 days.